Overview and Objective
In this lesson, students will analyze misleading graphs and use the table and chart tools on Polypad to remake more accurate representations of the data. Click here for a tutorial on the chart tools on Polypad.
Warm-Up
Share with students that Sabah Ibrahim's Tweet of this graph in April of 2020 received over 100,000 likes. In small groups or individually, invite students to reflect on why they think this image received so much attention. Invite students to share what they notice and wonder about the graph.
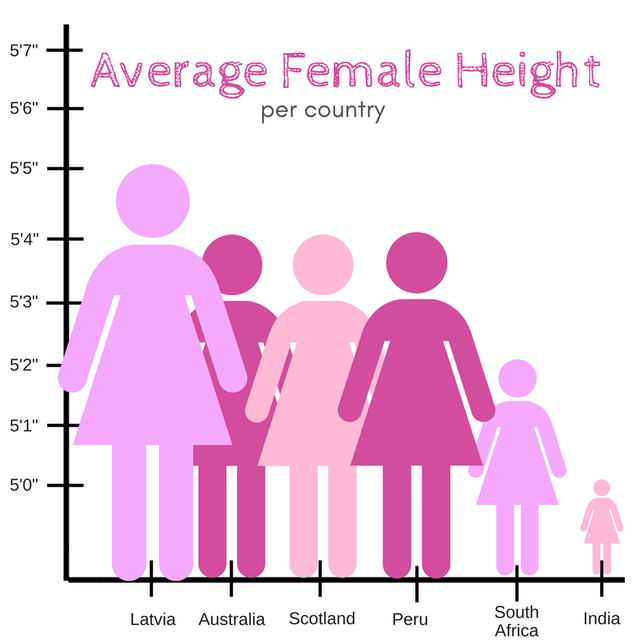
After a few minutes, invite students to share their reflections with the class. Students will likely share that the graph is misleading because the y-axis does not start at zero and because the the scaled up versions of the females are not proportional to their height. Pose the following questions to students:
- Why do you think the graph was created like this? Do you think the author was purposely trying to be misleading? If so, what point are they trying to make?
- How would you re-create the graph to make it more representative of the data?
Main Activity
Share this Polypad with students. In addition to the graph above, the Polypad contains these misleading graphs:
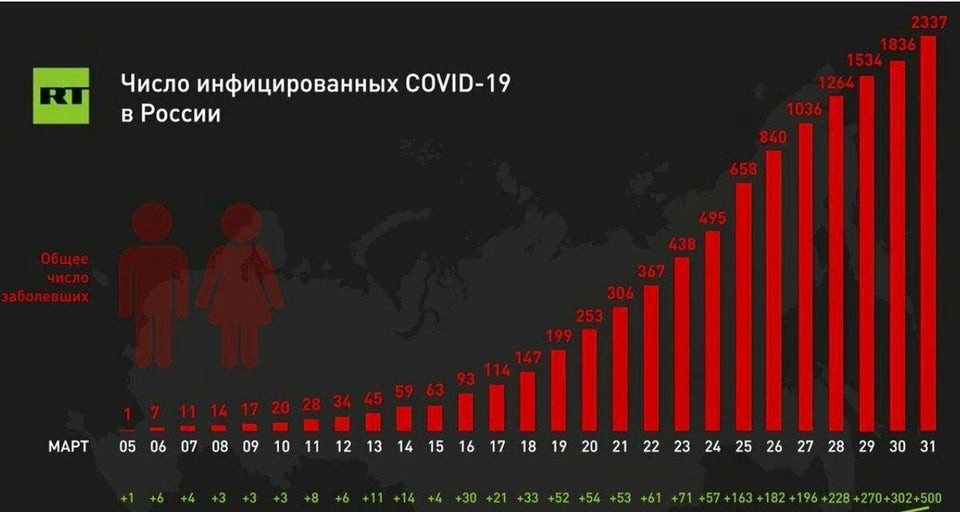
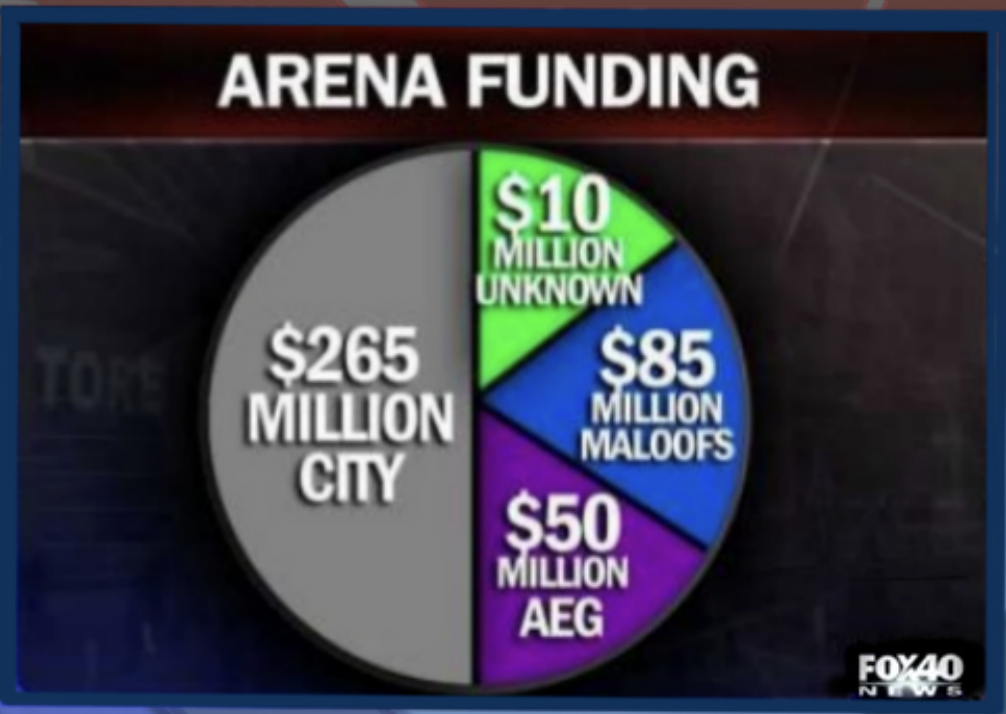
Click here to learn how to share Polypads with students and how to view their work. This Polypad contains three misleading graphs. For each graph, invite students to respond to the following prompts. Students can use the drawing and text tools within Polypad to respond to this or record their answer somewhere else.
- How is this graph misleading? What techniques did the author use to make the graph misleading?
- Why do you think the graph was created like this? Do you think the author was purposely trying to be misleading? If so, what point are they trying to make?
- Use Tables and Charts and Statistics features in Polypad to create a better representation of this data. Write a few sentences explaining why you believe your graph is a better representation of the data. Does your graph cause the viewer to reach a different conclusion from the data compared to the original graph? Explain.
Click here to see some possibilities of corrected graphs.
This lesson contains three examples of misleading graphs. Of course, there are many other examples of misleading graphs to choose from. Below are some resources to explore if you'd like to have your students engage with other misleading graphs. Be sure to preview these links first. Depending on the age of your students, some of the graphs may not be appropriate. Be cautious of sharing these links directly with students.
- TURDs (Truly Unfortunate Representations of Data) on Twitter
- matharguments.com
- hailstonesequence.com
Closure
Share some students' work with the class and invite them to explain their work to the class. Be sure to include as part of the discussion what made the graph misleading and what might have been the possible motivation of the author of the graph. This article provides a nice overview of the variety of ways to create misleading graphs.
Extension
Invite students to research a topic of interest to them and create a misleading graph that tells the story from a particular viewpoint. Encourage them to share the graph with the class and see if their classmates can determine what view they were trying to promote. Then, students can create a better representation of the data.